Performance Graphs Block
About Performance Graphs Block
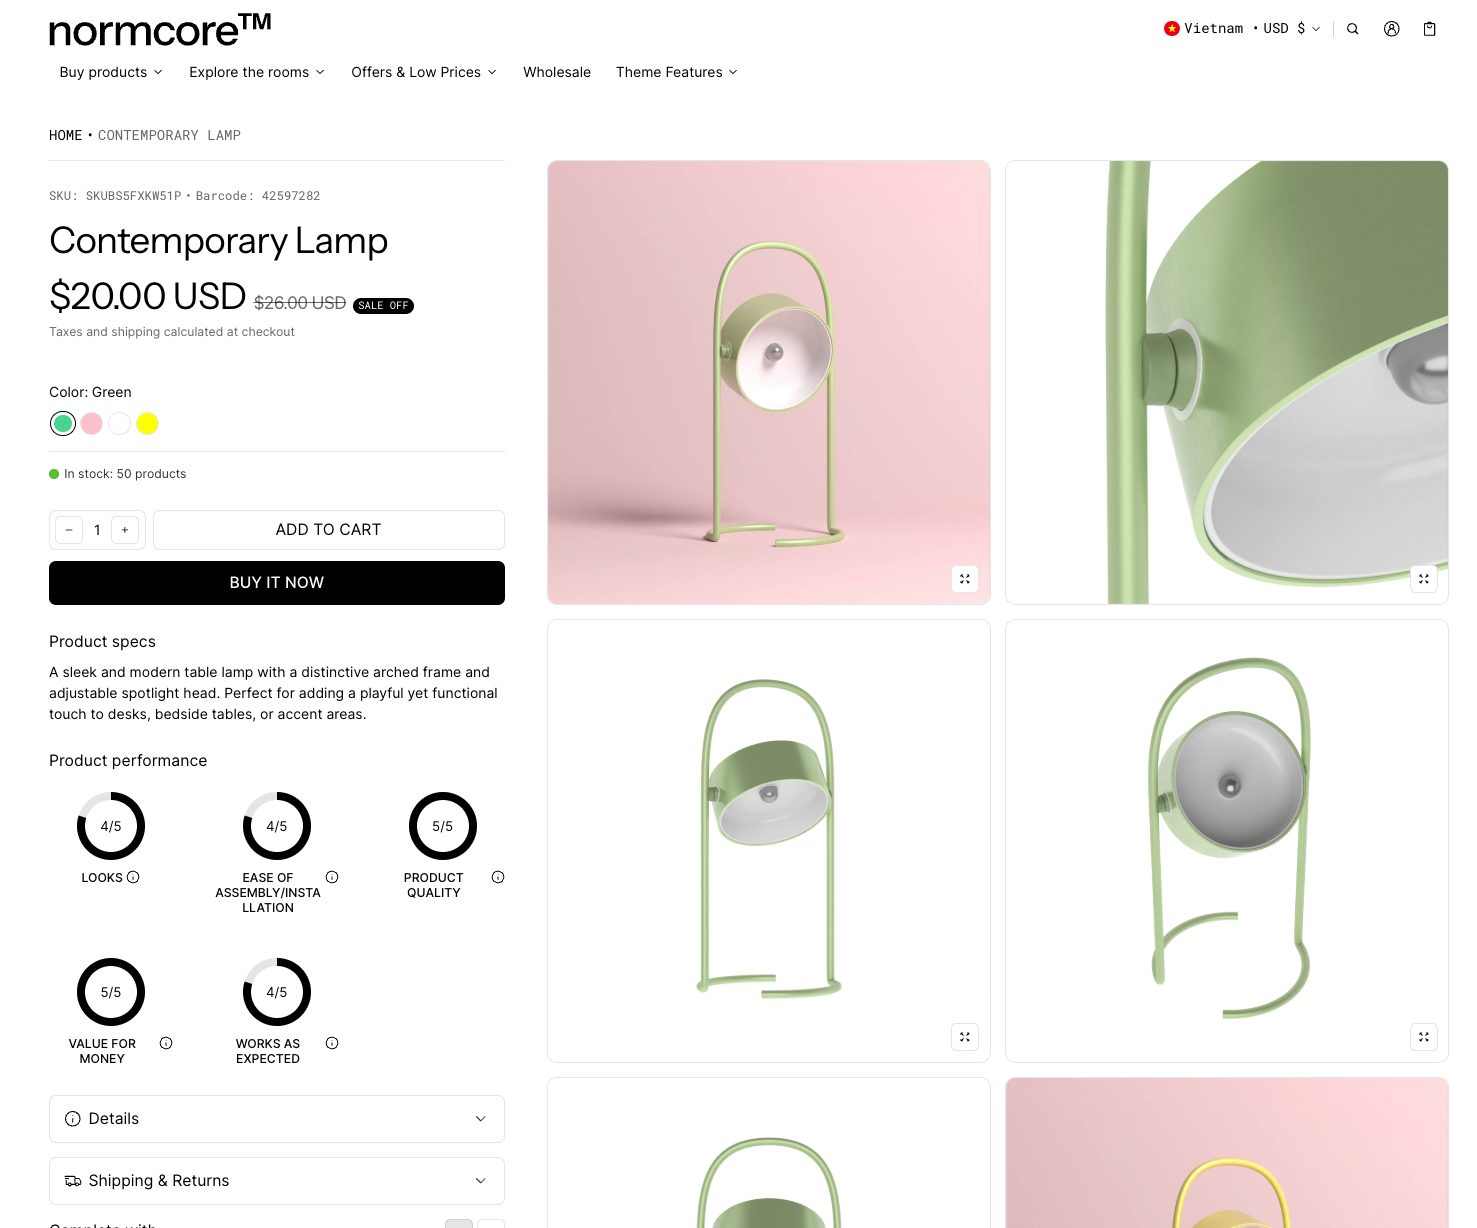
The Performance Graphs block is a dynamic visualization tool that helps showcase your product’s key metrics and features through intuitive graphical representations. It enables you to display:
- Product performance metrics
- Product fit analysis
- Multiple graph comparisons
The section stands out for its flexibility in presenting data through both circular and linear graph styles, with customizable colors and collapsible display options to enhance the user experience.
How to Access Performance Graphs Block
Performance graphs belong to the product details section (on the product template) and the Featured product section. You can access it
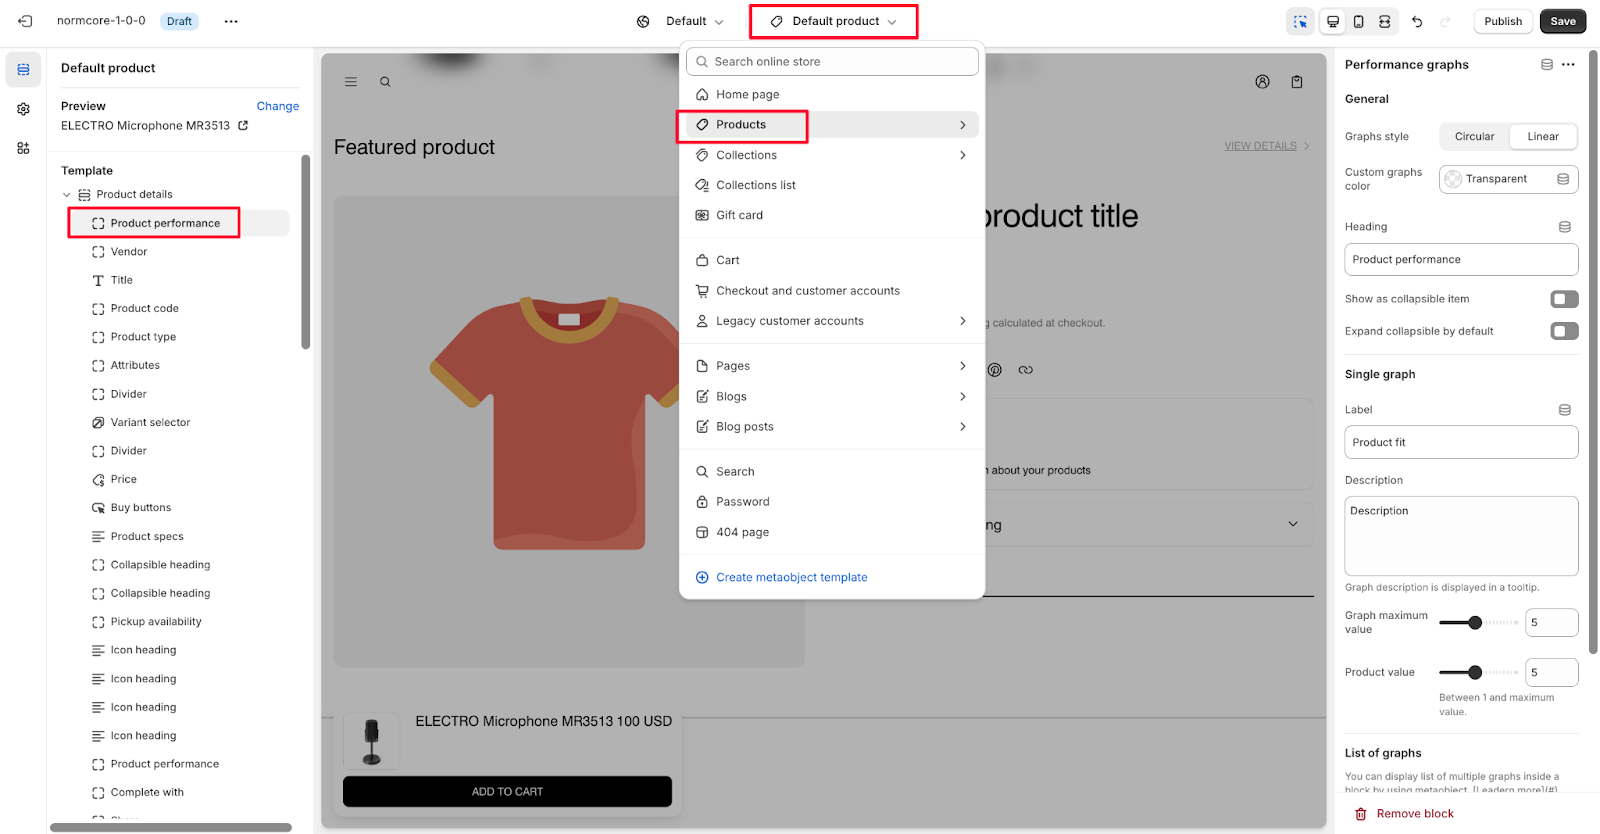
From Product details section
- From your Shopify Themes, customize your active theme
- Select any product from the top center bar to access the Product template
- On the Product details – default section, we set a Product performance
- Or click “Add block” where you want to add the Performance graphs
- Search for “Performance graphs” and select it
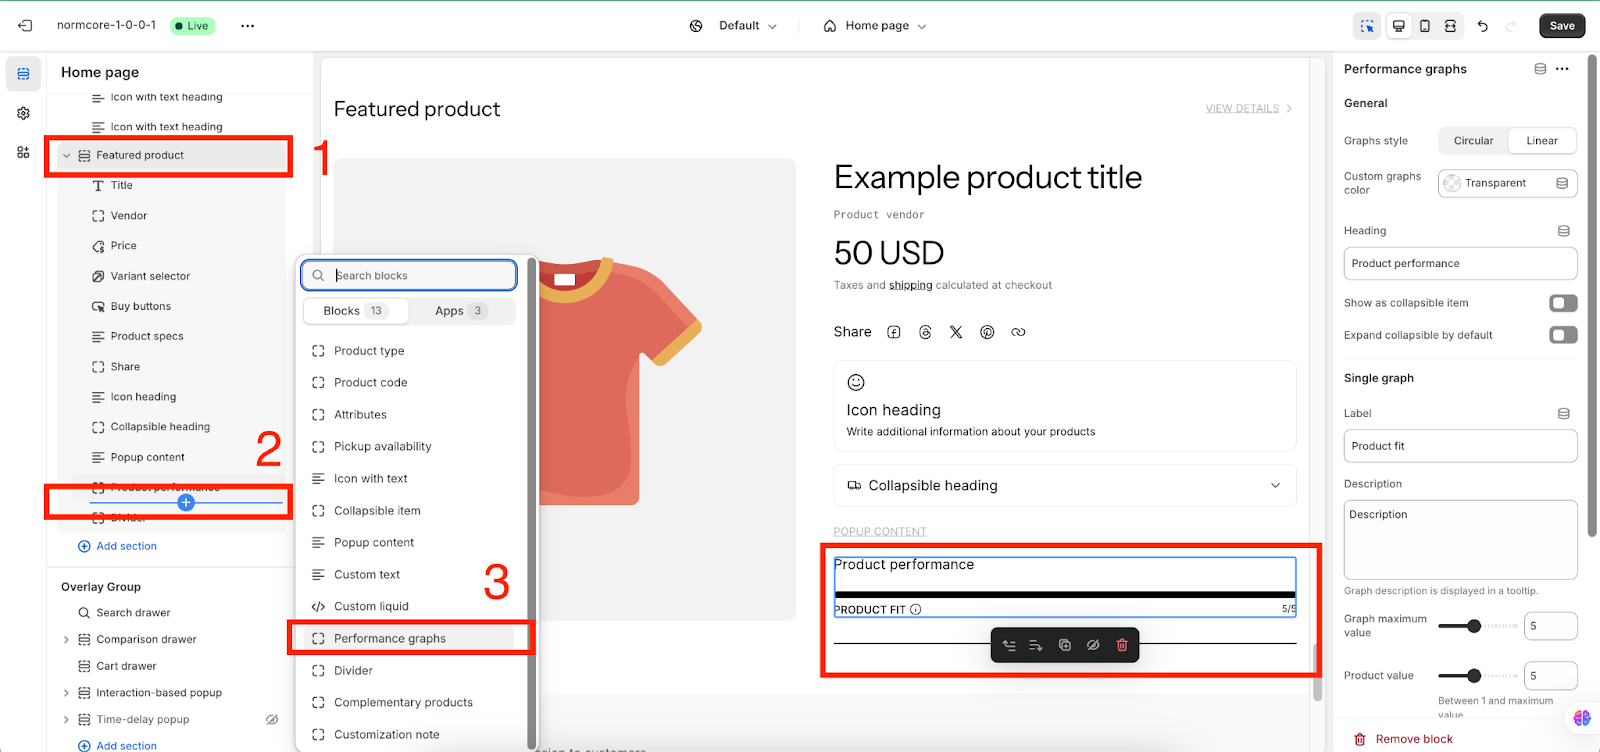
From Featured product section
- From your page, click “Add section” and select the Feature Product section
- In this section, click “Add block” where you want to add the Performance graphs
- Search for “Performance graphs” and select it
After adding the Performance graphs, customize its appearance and functionality using the available settings.
How to Configure Performance Graphs Section
Basic Components
Each Performance Graphs section includes these default components:
- General settings configuration
- Single graph customization
- List of graphs functionality
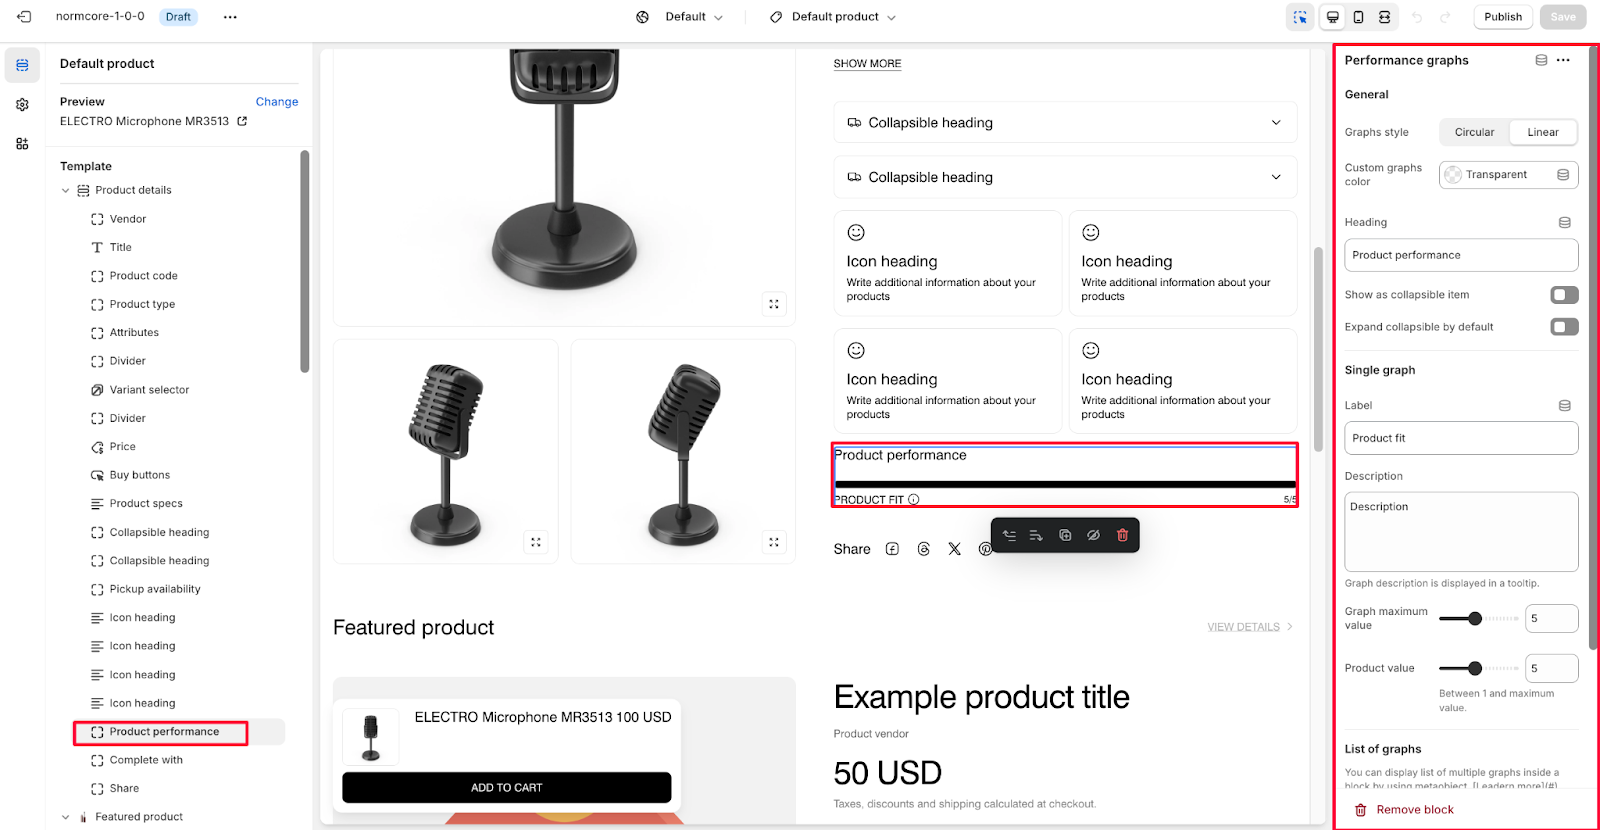
To begin customizing, click the “Performance Graphs” section to access its settings.
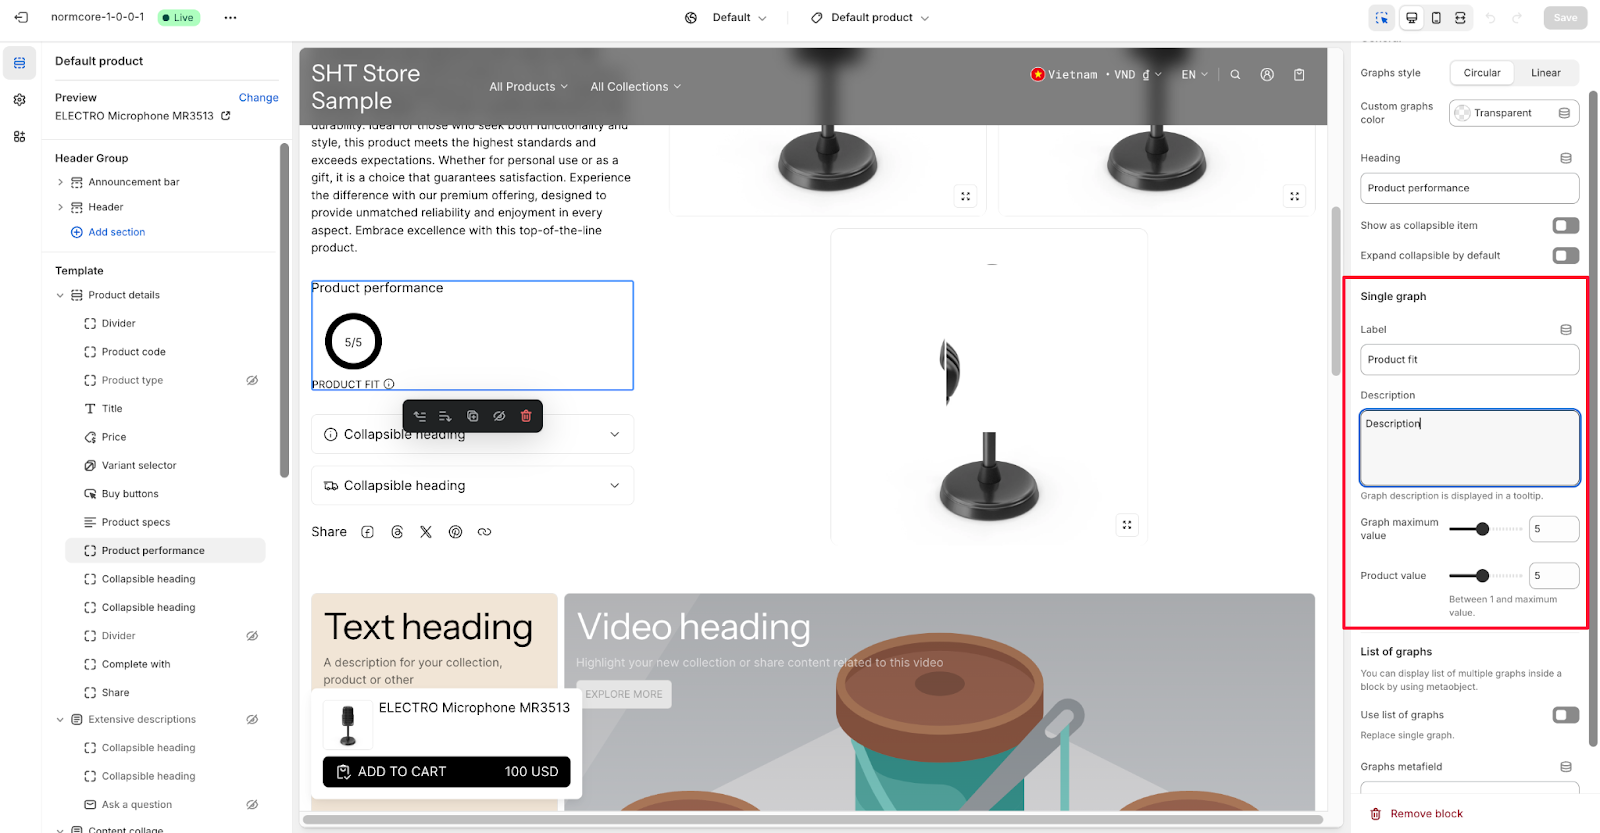
General
Within General settings, you can:
- Choose between Circular or Linear graph style
- Set custom graphs color with Transparent option
- Configure Heading text (default: “Product performance”)
- Toggle “Show as collapsible item” option
- Enable/disable the “Expand collapsible by default” setting
Single Graph Configuration
Under the Single graph settings, you can customize:
- Label (example: “Product fit”)
- Description field with tooltip display
- Graph maximum value (between 1 and maximum value)
- Product value settings
- Graph description that appears in a tooltip
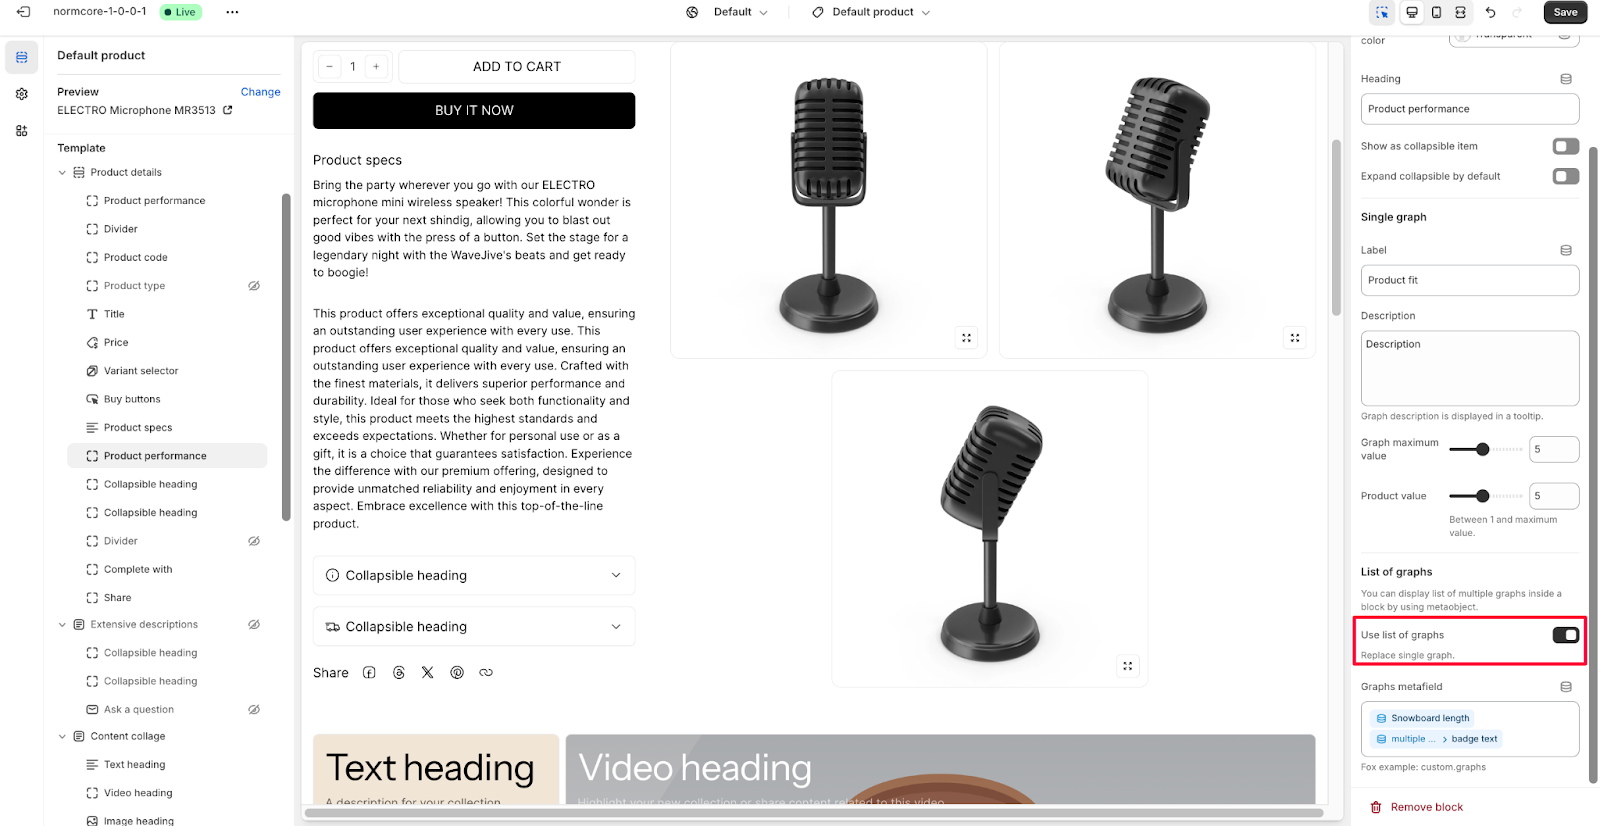
List of Graphs
You can display a list of multiple graphs inside a block by using the product metaobject.
To configure a list of graphs:
- Toggle the “Use list of graphs” option to replace a single graph
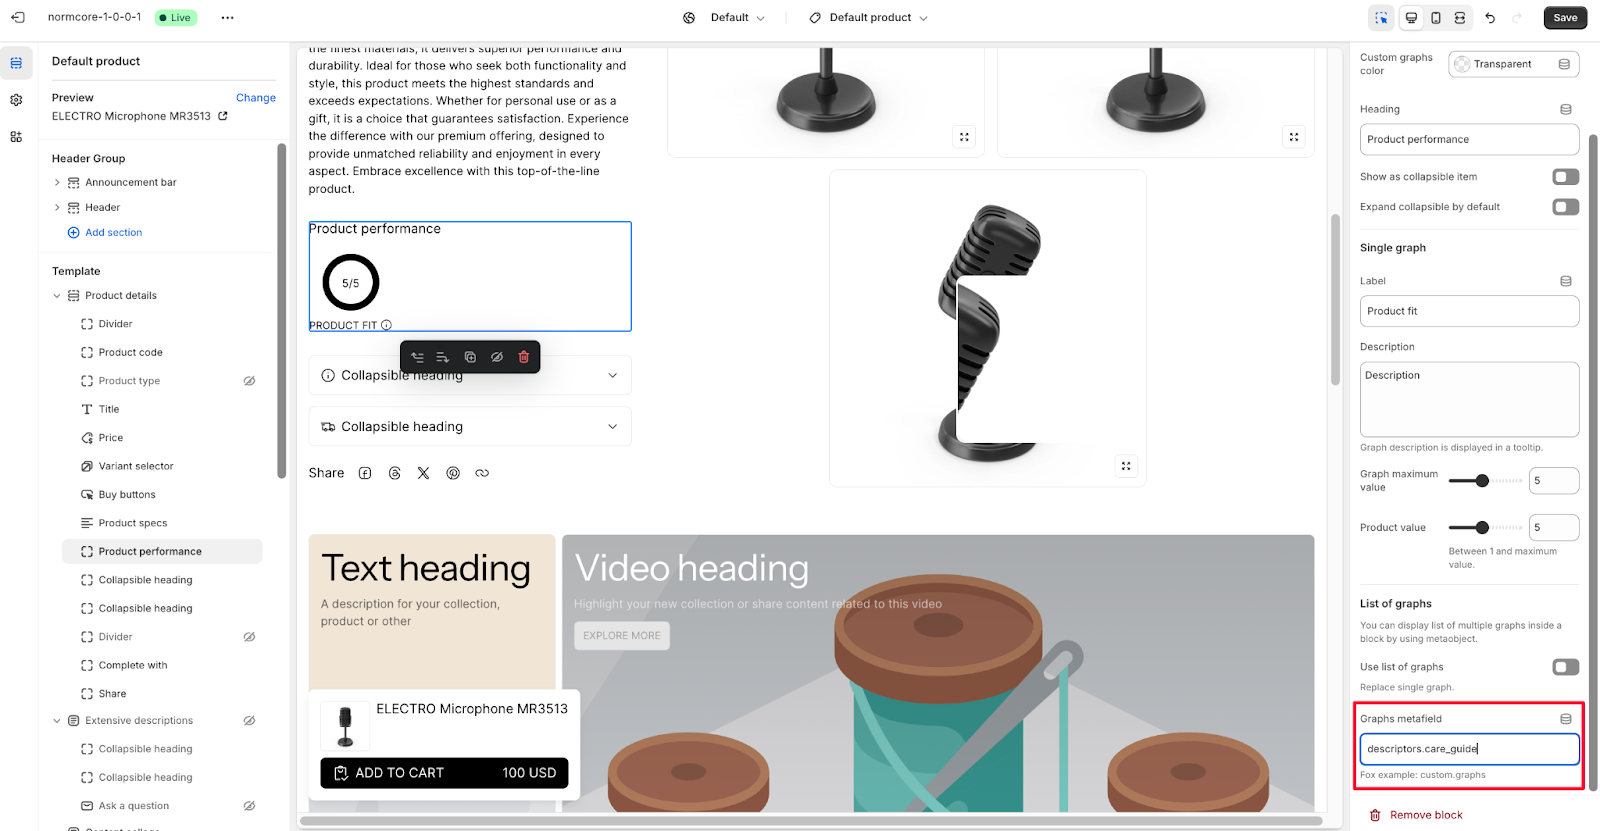
- Set up Graphs metafield
This section allows you to show multiple performance metrics by replacing the single graph display with a collection of graphs.
How to Create Metaobject Used in Performance Graphs Block
Step 1: Create the metaobject in the form of “list entries” with the following requirements:
- Label (single line text)
- Description (multi-line text)
- Maximum value (integer)
- Product value (integer)
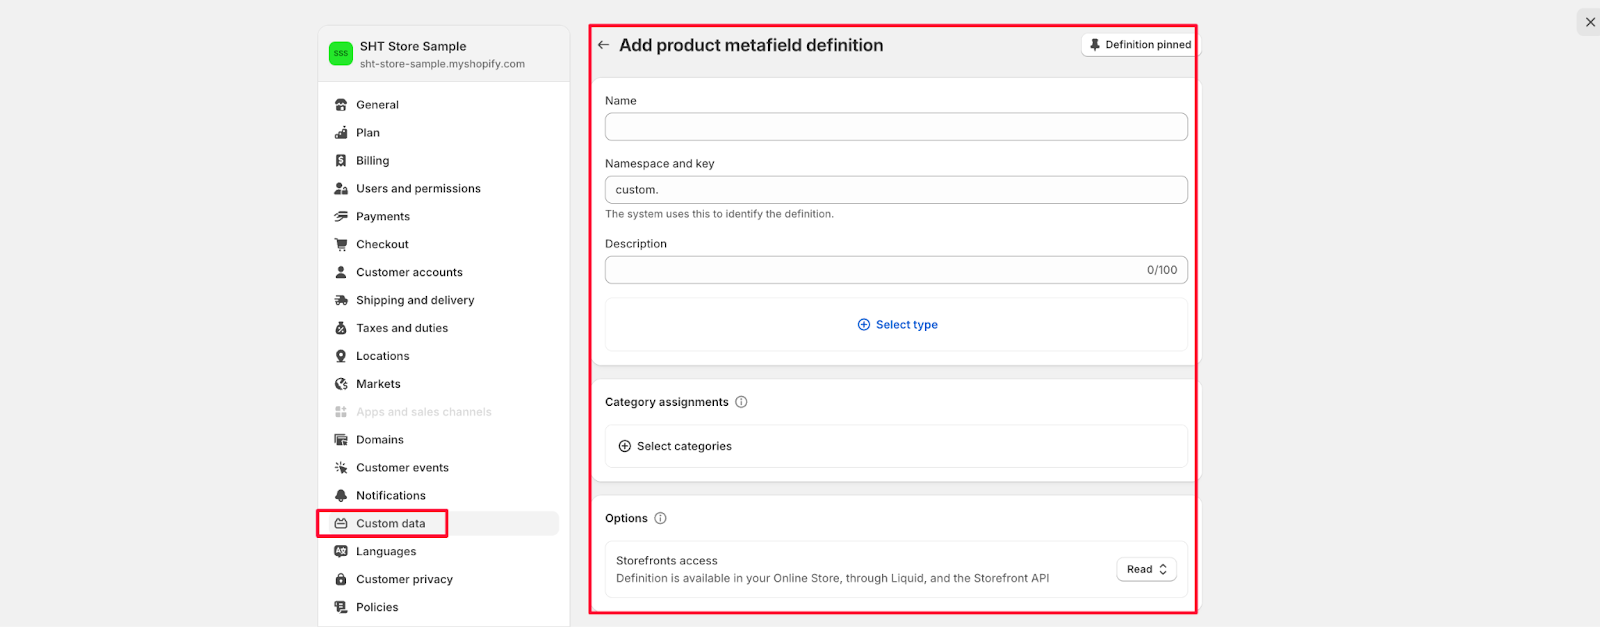
Step 2: Create the metafield by going to Shopify Admin Settings > Custom data and filling in all the required fields.
Step 3: Go to product, and add value to products.
Step 4: Go to theme editor, access the product template, add and click on block “performance graphs“. Then, enable “Use the list of graphs“.
Step 5: Fill in the namespace name and key of the metafield just created.
Common Cases and FAQs
1. How to optimize graph readability on different devices?
When setting up Performance Graphs, you can:
- Use clear, descriptive labels for each graph
- Keep maximum values reasonable (recommended between 1-5 for best visibility)
- Ensure descriptions are concise and informative for tooltip display
2. When should I use circular vs linear graphs?
- Choose Circular graphs for:
-
- Single metric comparisons
- Percentage-based data
- Compact visual representation
- Choose Linear graphs for:
-
- Trend analysis
- Multiple data point comparison
- Detailed performance tracking
3. How can I display multiple graphs efficiently?
Use the list of graphs feature with metaobject when you need to:
- Show multiple performance metrics at once
- Compare different product attributes
- Create a comprehensive performance dashboard
4. How to make graphs more interactive?
Enable these features for better user interaction:
- “Show as collapsible item” for cleaner interface
- “Expand collapsible by default” for immediate visibility
- Add descriptive tooltips using the Description field
5. What are the best practices for graph descriptions?
- Keep descriptions clear and concise
- Include key metrics and what they mean
- Use consistent terminology across all graphs
- Remember that descriptions will appear in tooltips
